Conflict Mapping Infographic Series
Data visualization, InfographicConflict Mapping Infographic Series
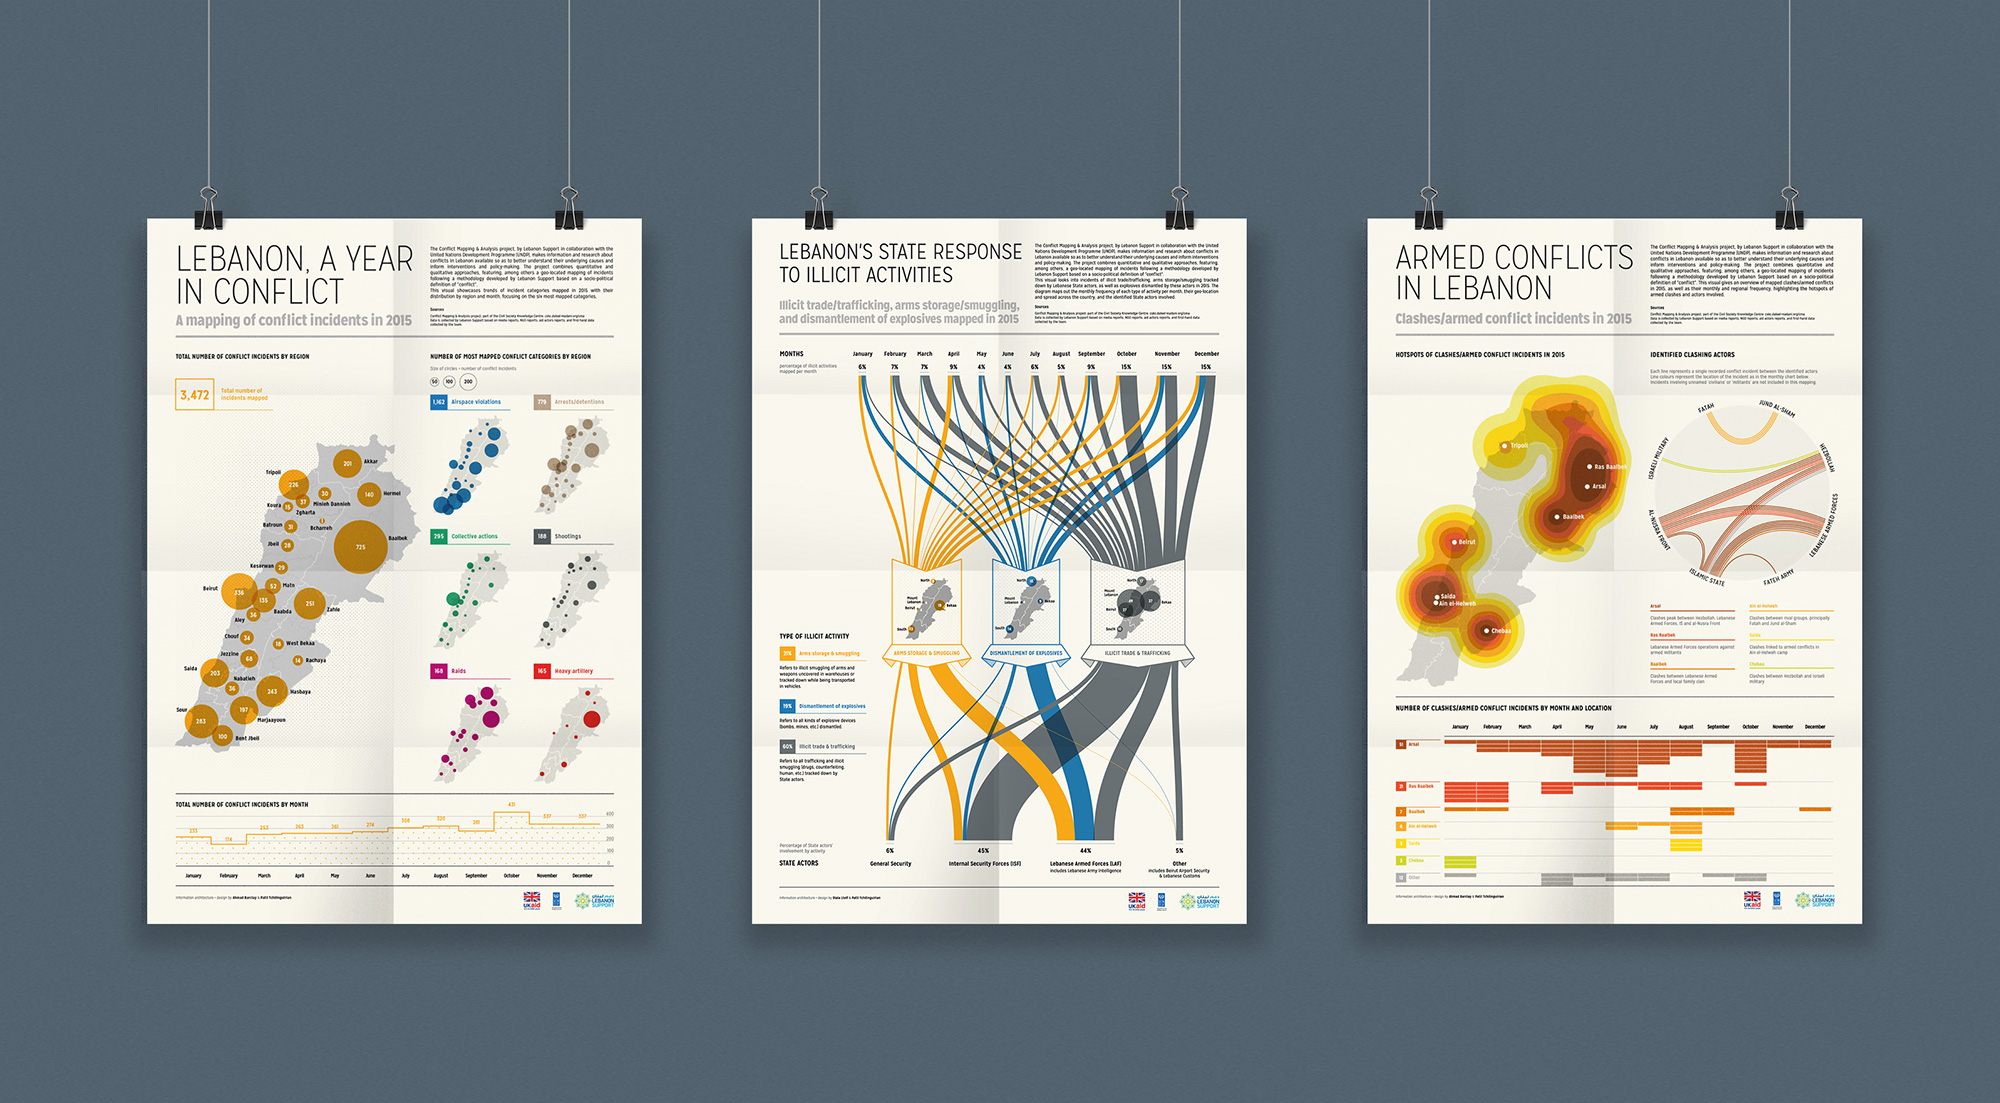
The Conflict Mapping and Analysis Project, by Lebanon Support in collaboration with United Nations Development Programme (UNDP), makes information and research about conflicts in Lebanon available so as to better understand their underlying causes and inform interventions and policy-making.
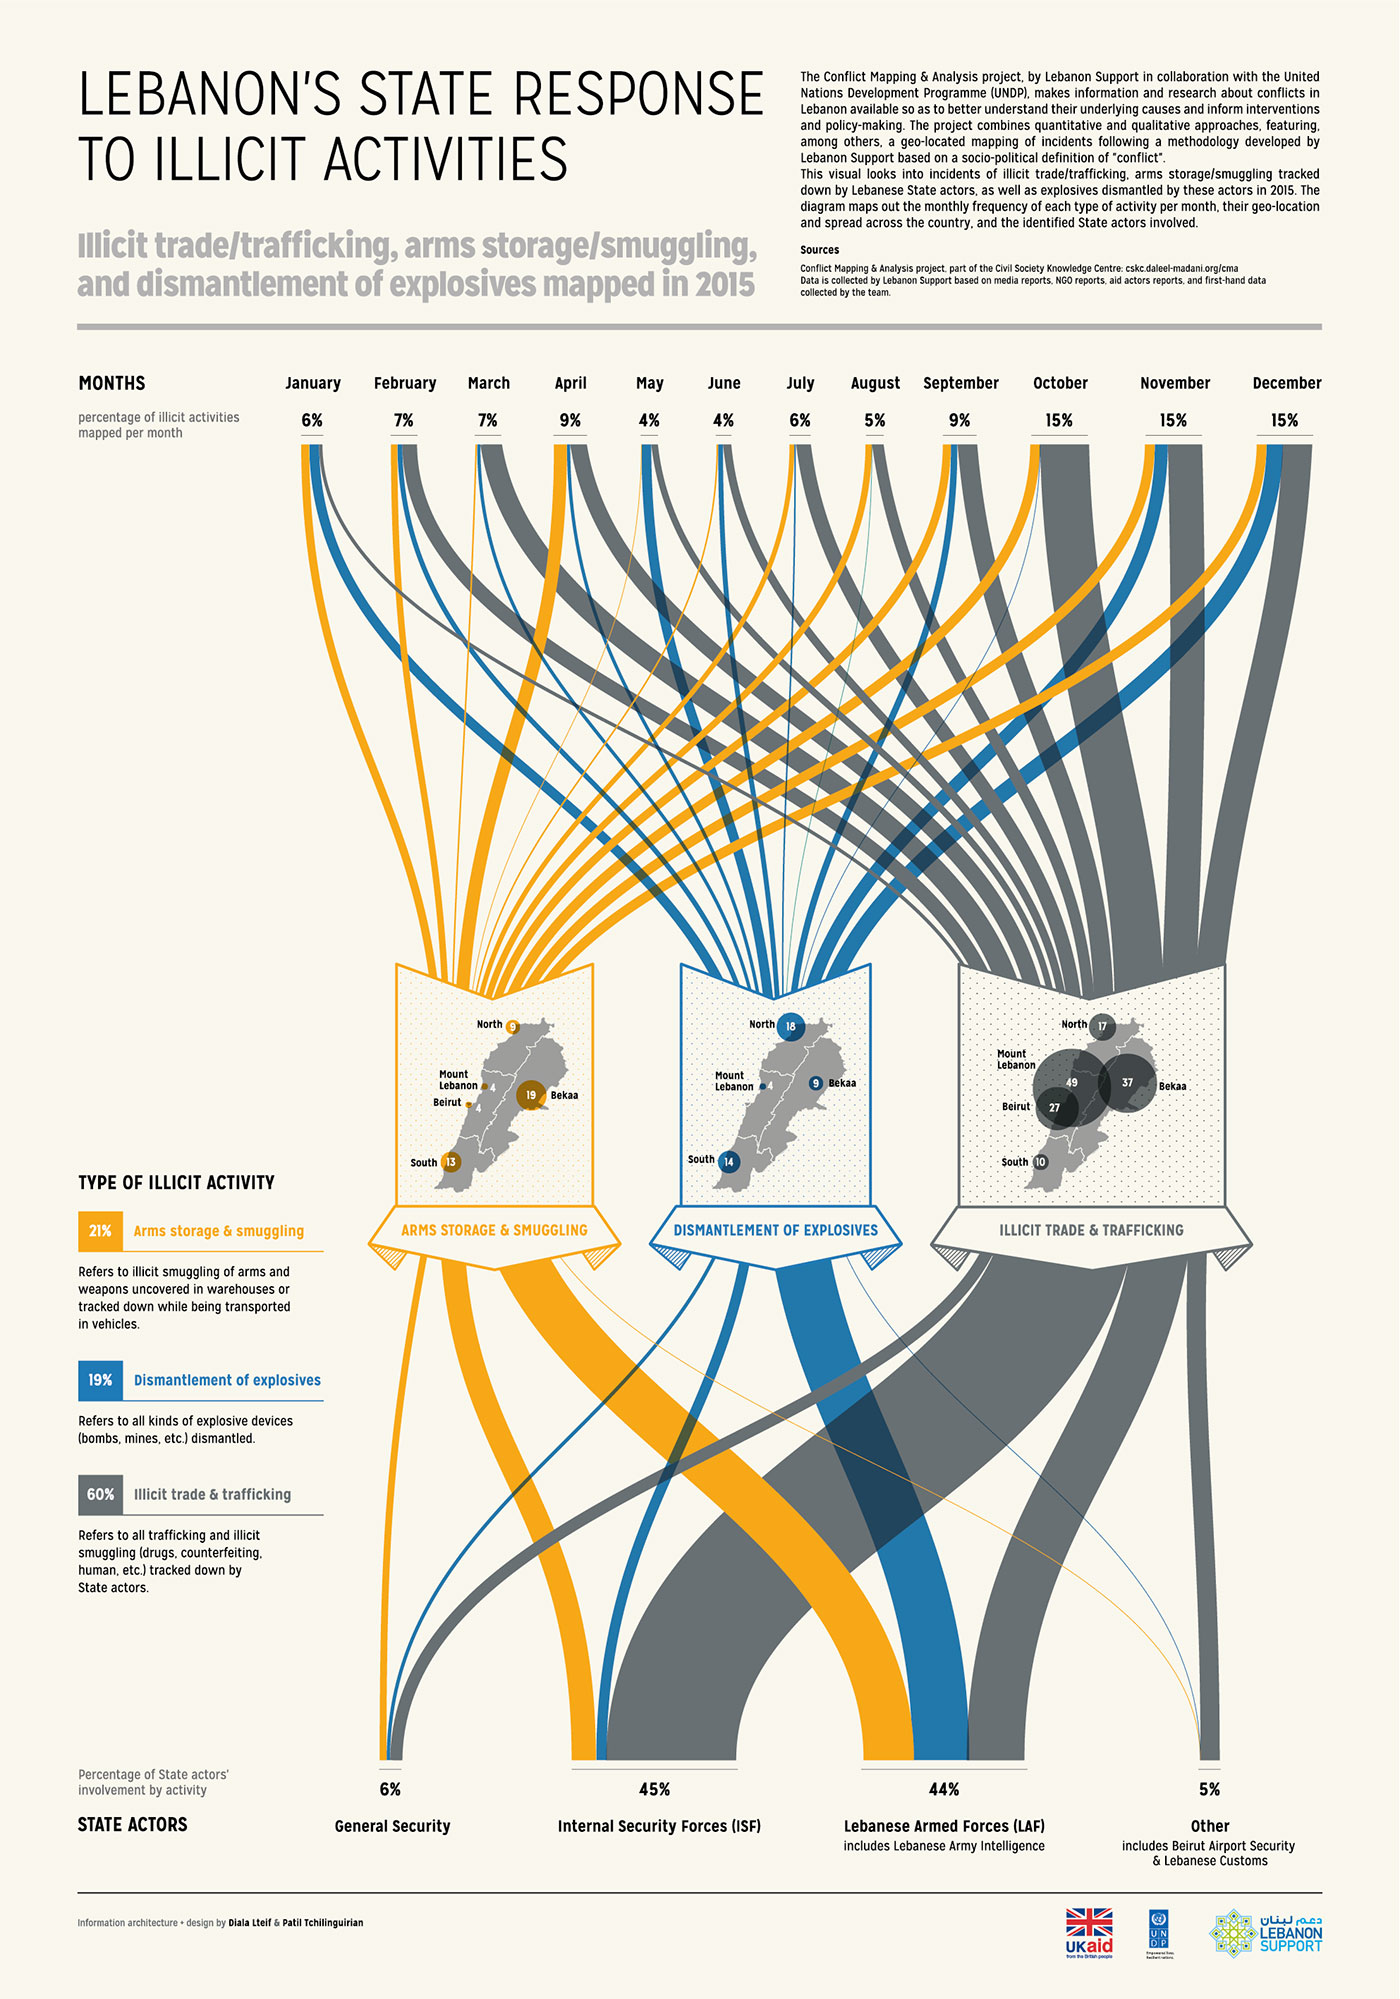
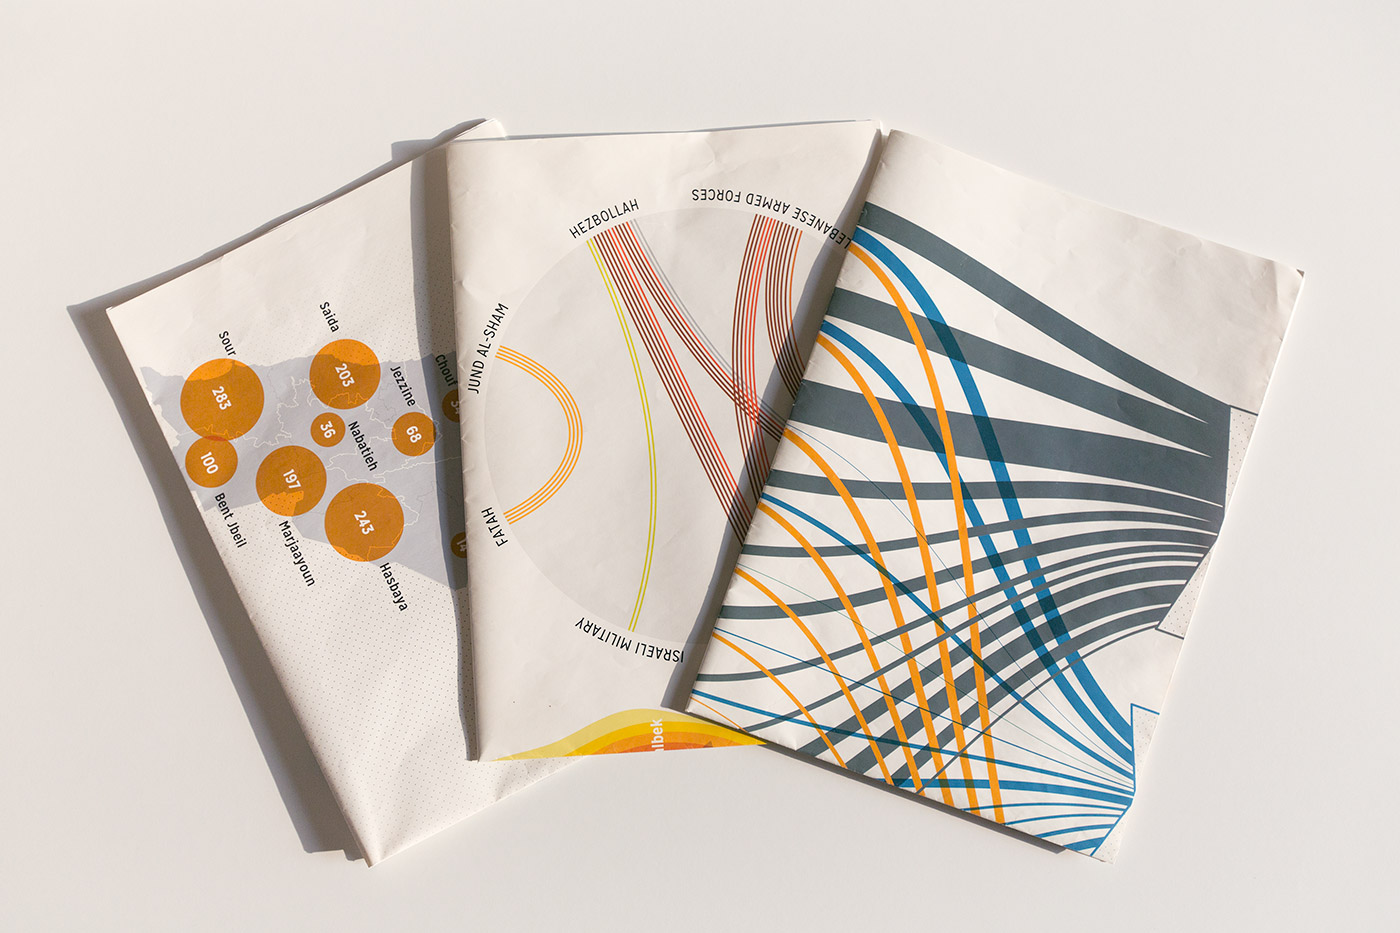
Lebanon’s State Response to Illicit Activities infographic is part of the Conflict Mapping and Analysis Project. The visual looks into incidents of illicit trade/trafficking, arms storage/smuggling tracked down by Lebanese State actors, as well as explosives dismantled by these actors in 2015. The alluvial diagram maps out the monthly frequency of each type of illicit activity, their geo-location and spread across the country
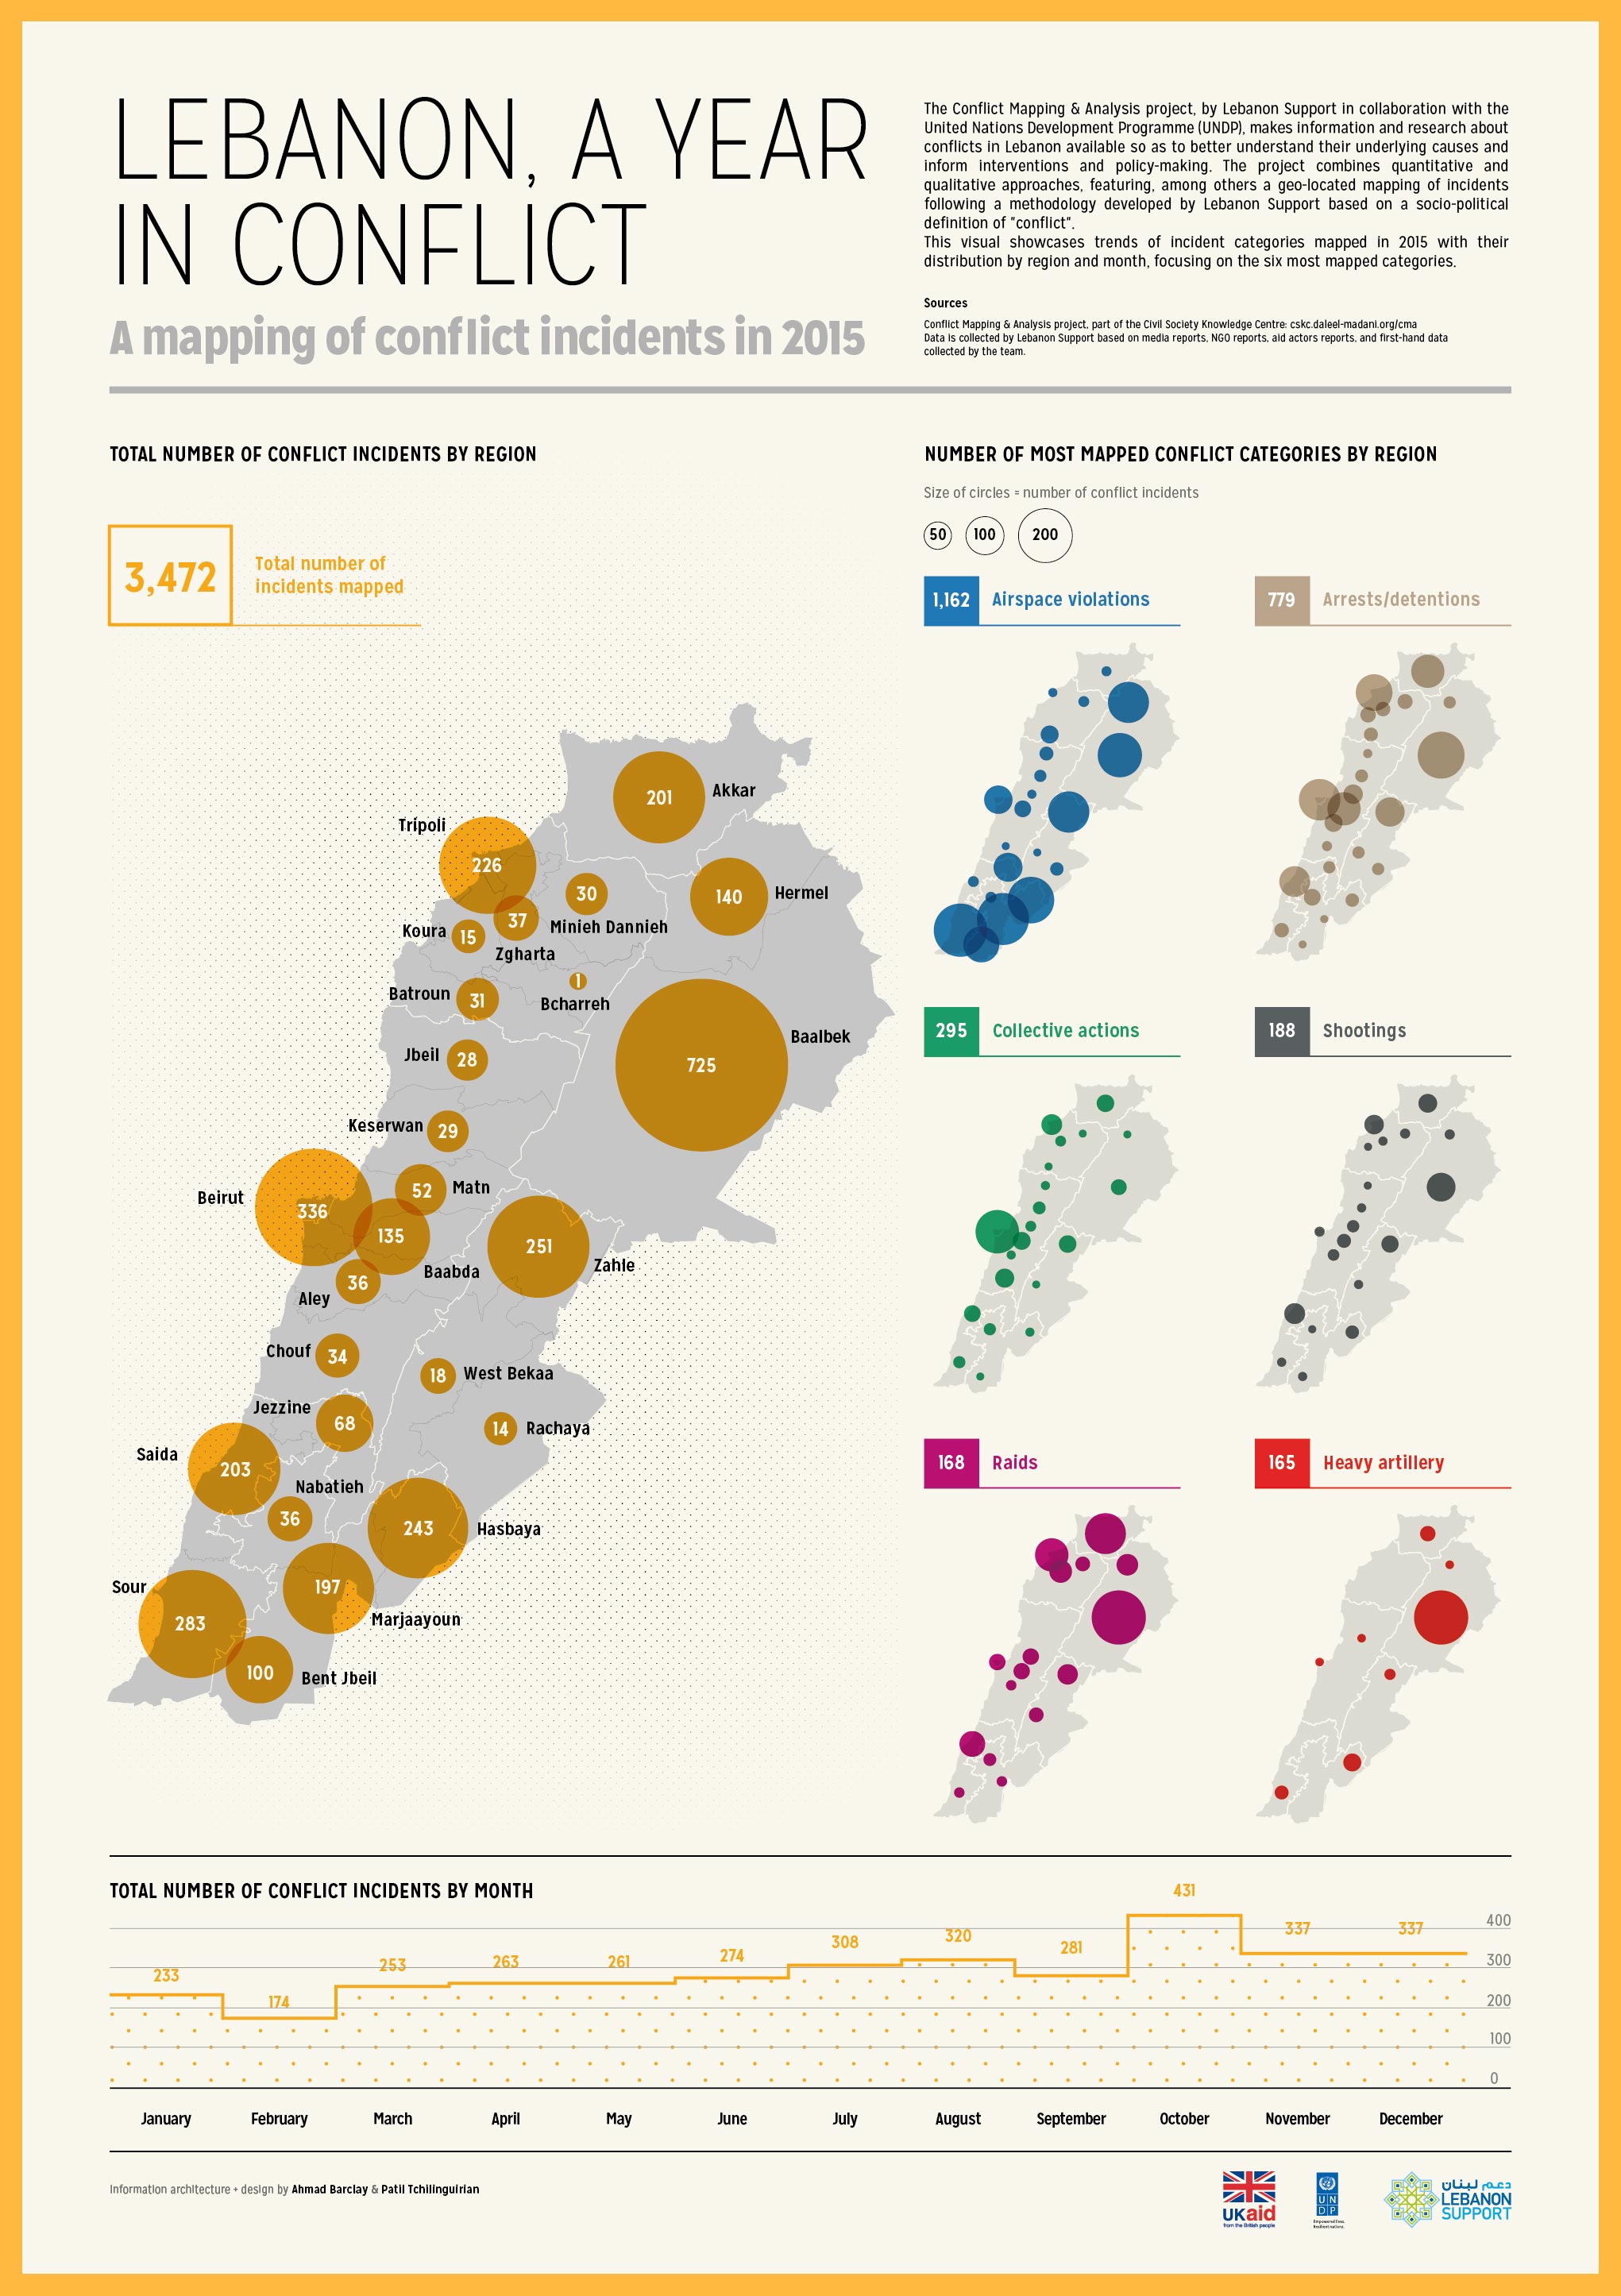
Lebanon, a Year in Conflict infographic showcases trends of incident categories mapped in 2015 with their distribution by region and month, focusing on the 6 most mapped categories such as: airspace violations, arrests/detentions, collective actions, shootings, raids and heavy artillery.
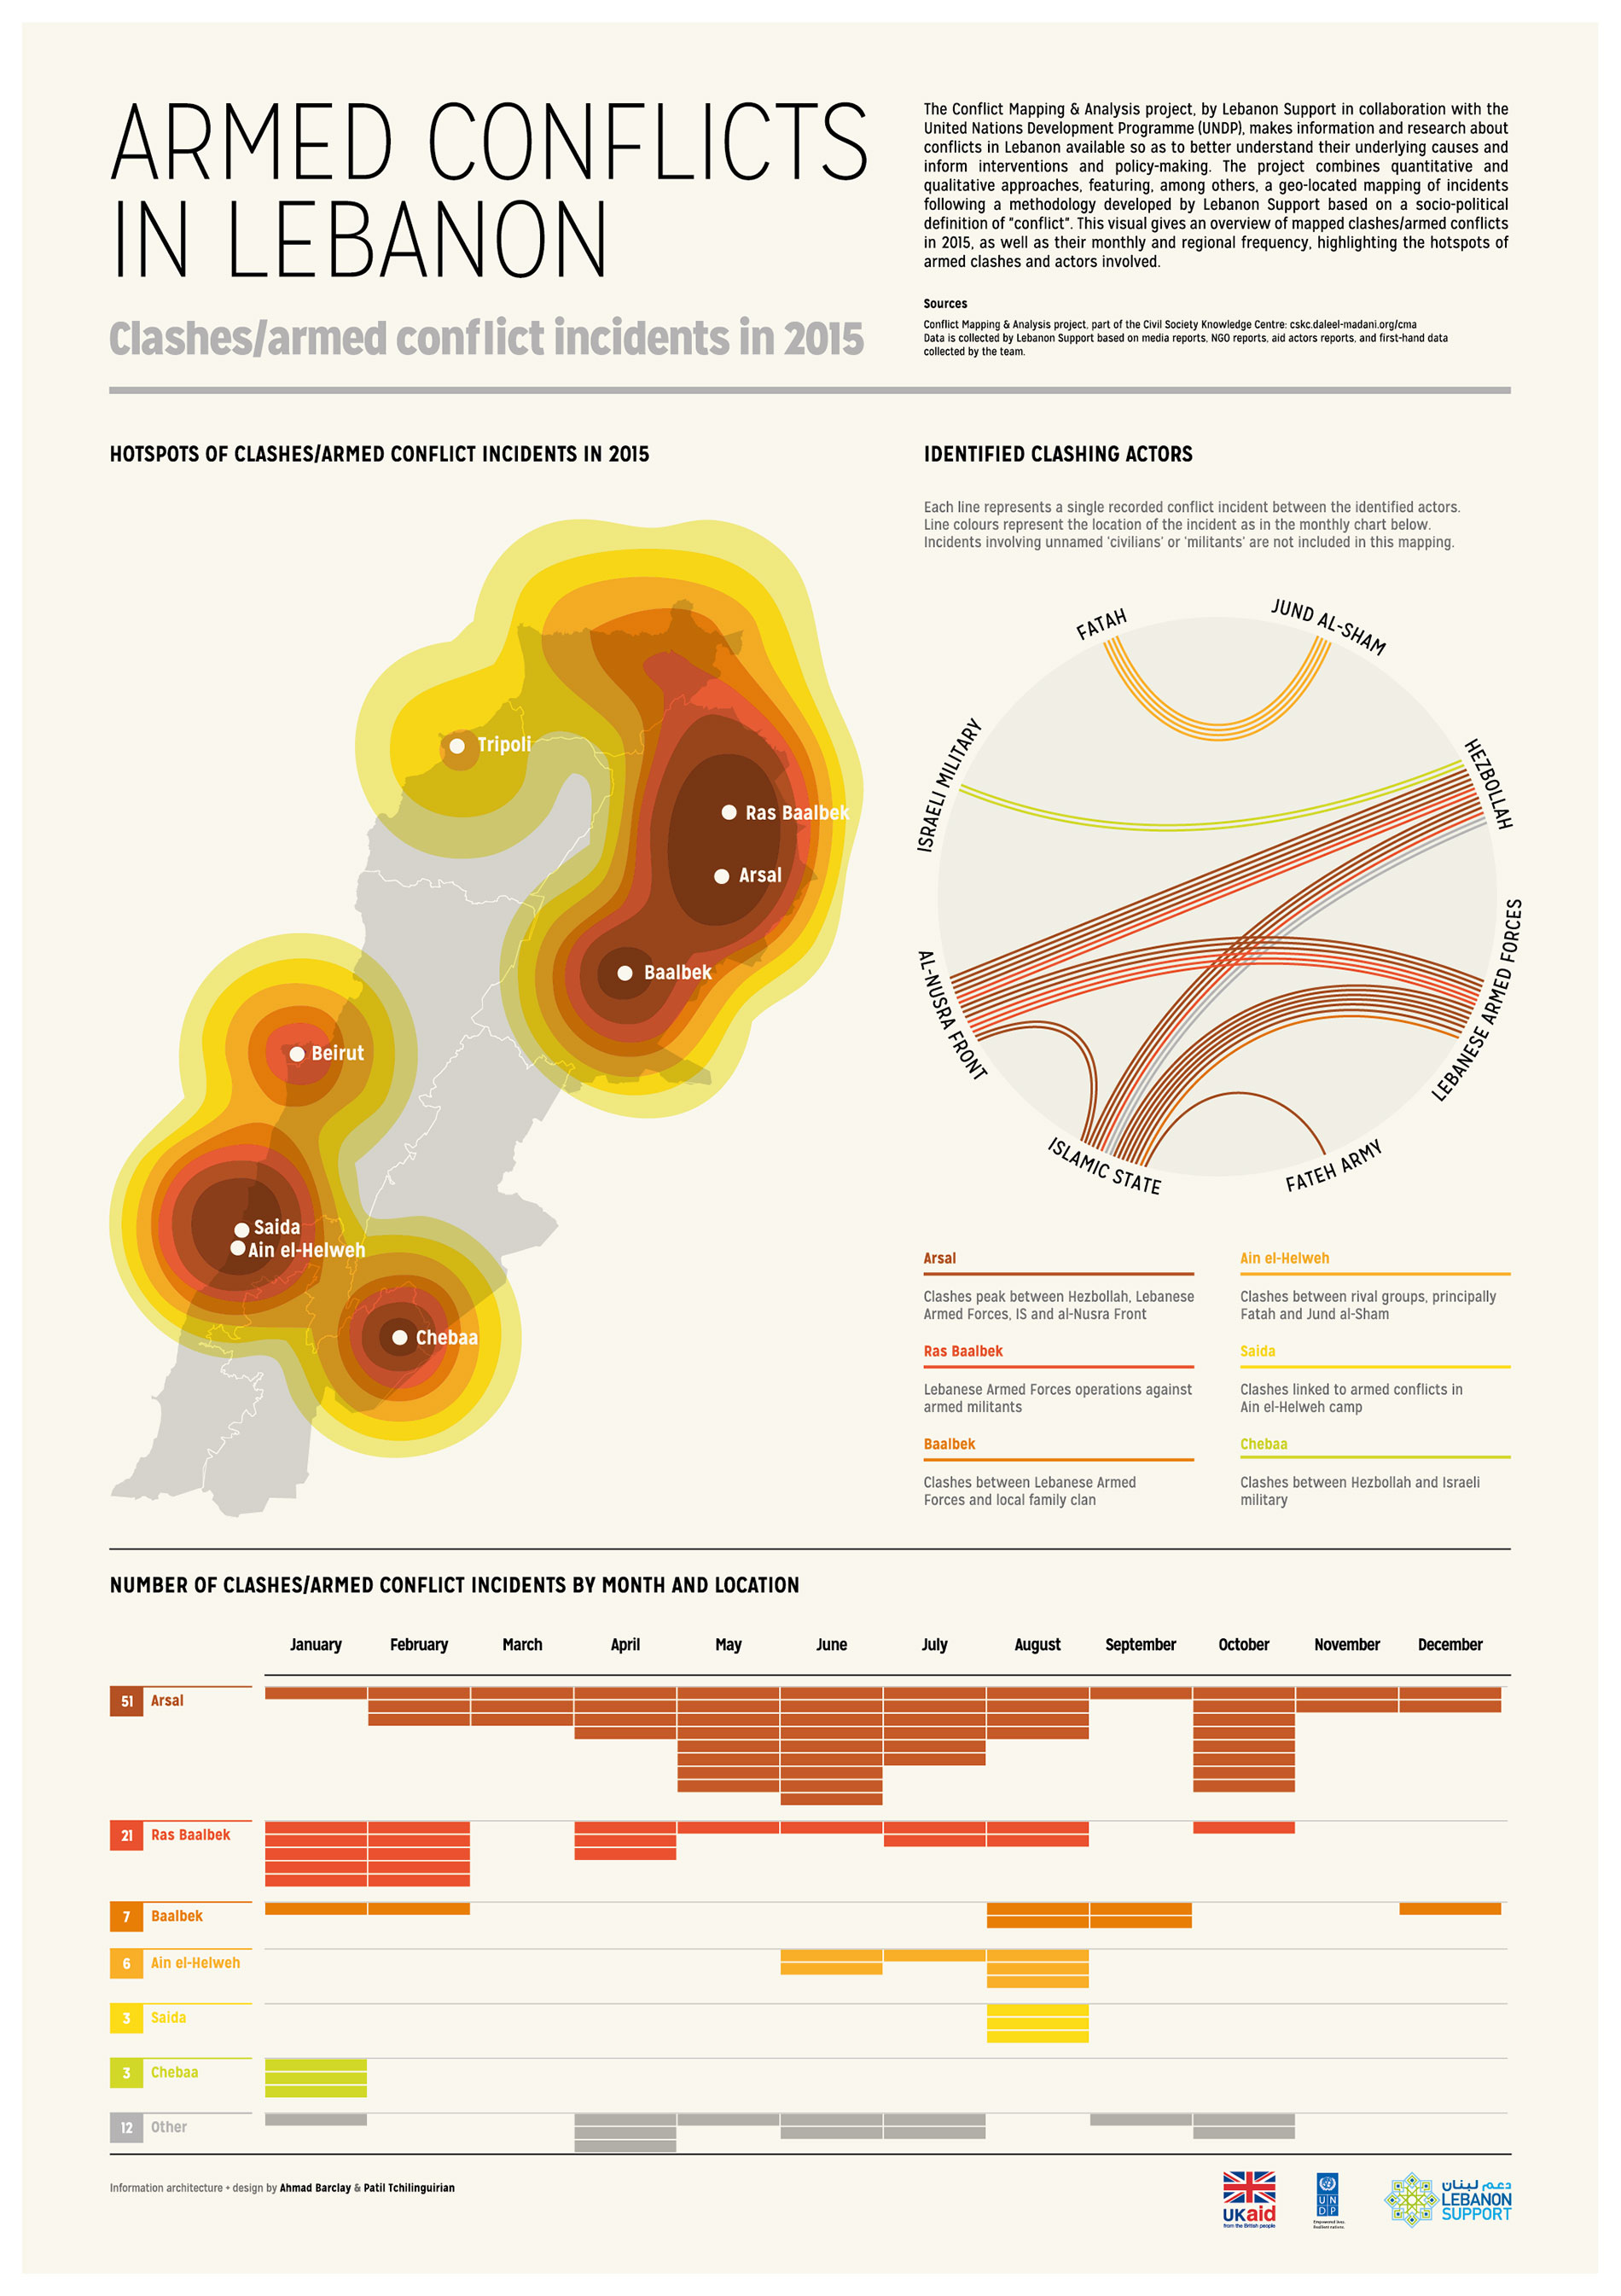
Armed Conflicts in Lebanon infographic gives an overview of mapped clashes/armed conflicts in 2015, as well as their monthly and regional frequency, highlighting the hotspots of armed clashes and actors involved.
In collaboration with:
Diala Lteif and Ahmad Barclay